


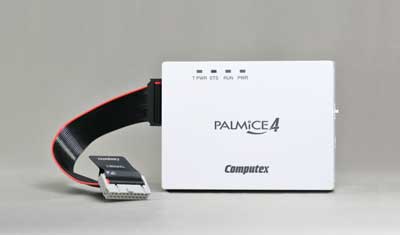
PALMiCE4 JTAG Emulator
PALMiCE4 JTAG emulator supports various 32-bit and 64-bit Arm cores and Features of PALMiCE4
Available models
Real-time debugging feature
|
||||||||||||||||||||||||||||||||||||||||||||||||||||||||||||||||||||||||||||||||||||||||||||||||||||||||

PALMiCE4 supports unstoppable system debugging with three features.
|
|
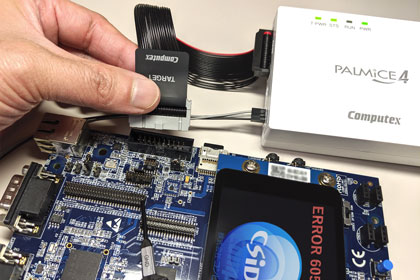
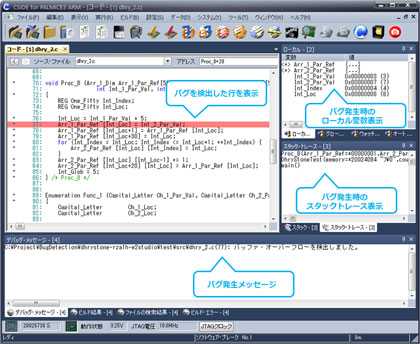
1.Connect to a system that is running [Hot plugin debugging]Debug in the field/test environment without turning off target powerThe target can be debugged without turning off its power. Problems that occur when the target is operating can be debugged easily. Variables, peripherals, and program execution related stuff can be checked by combining Real-time monitor and trace feature. The following situations can be analysed with ease:
|
|
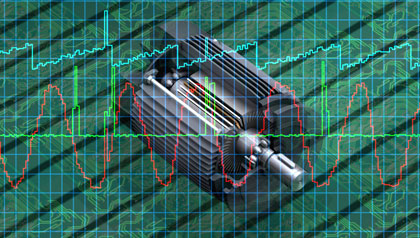
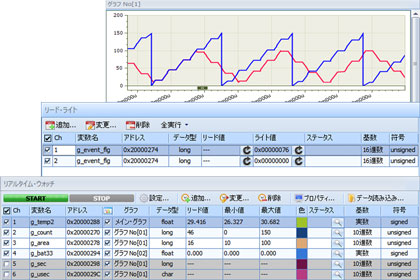
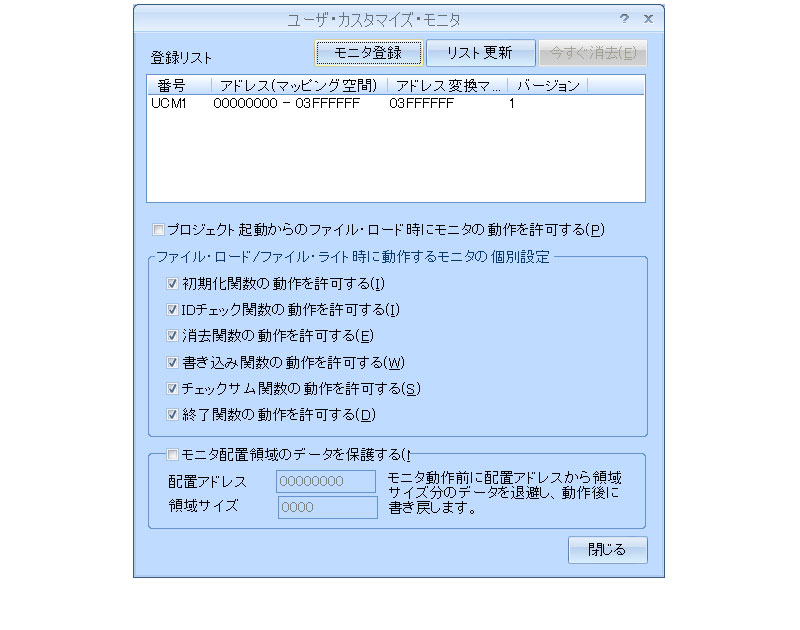
2.Check data in real time [Real-time monitor]Variables and peripherals can be analysed and changed without stopping the programMemory changes can be monitored in real time without changing the program. As one of the applications, this feature can be used for parameter adjustment of control equipment and detecting abnormal values.
|
|
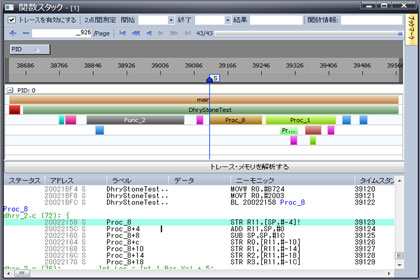
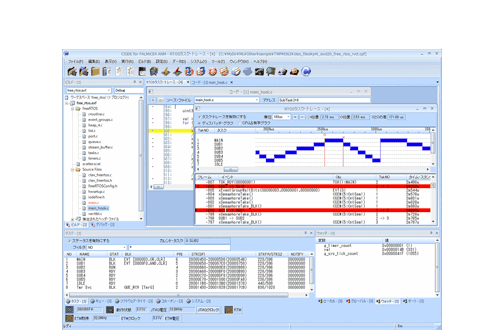
3.Check the program in real time [Trace]Check execution information and flow without stopping the programWith the Trace feature, one can analyze the operation of the program even while the program is running. As an example, it is possible to investigate the cause of a deadlock or infinite loop that has occurred currently.
|
|
|
Model-T
|
|
|
|
|
Conventional functions
 Multi-core support
Debug Multi-core CPUs, heterogeneous multi-core CPUs with execution and break for each core. µITRON and Linux are supported as well.
Undo trace function
Break when an exception occurs due to a runaway program. Combined with ETB, it is useful for analyzing the cause of exceptions.
Vector catch / break function
Using registers and memory values saved as history, registers and memory values are returned in a pseudo manner when the program goes too far due to trace execution or when the program behaves unexpectedly during debugging etc.
Low voltage support and voltage measurement function
Target voltage value (VTref signal) is automatically monitored and displayed. Supported voltage range is 1.65V to 5.5V.
FPGA configuration support
The Xilinx Zynq processor allows you to configure the FPGA via the JTAG interface.
Serial flash memory support
|
Read/ write serial flash memory connected to SPI multi-I/O interfaces and bus controllers such as RZ/A1L and RZ/A1H.
|
|
|
|
|
|
Main specifications
| PALMiCE4 Model-J JTAG model |
PALMiCE4 Model-T Large capacity trace model |
|
|---|---|---|
| Debugging function | ||
| Go / Break / Step execution control | ||
| Multi-core support | ||
| Built-in flash ROM write | ||
| Bug detection function | ||
| Real-time monitor*1*2 | ||
| Trace function*2 | ||
| CPU built-in trace (stored in dedicated memory inside CPU) ETB / MTB |
||
| CPU external output trace (stored in PALMiCE memory) ETM (PTM)*1 |
4GB | |
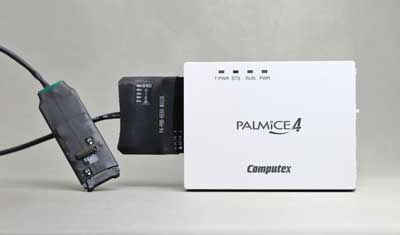
| Target interface connector | ||
| JTAG 20pin (2.54mm) | ||
| HP-20pin (1.27mm), 10pin | ||
| Mictor 38pin | ||
| Standard probe length *Does not include conversion adapter |
About 20cm | About 45cm |
| Trace function | ||
| HOST I/F | USB3.0 / USB2.0 | USB3.0 / USB2.0 |
| Power supply | USB Vbus | USB Vbus*3 |
| External shape | 108mm(W)x81mm(D)x28mm(H) *Excluding the connector part |
108mm(W)x81mm(D)x28mm(H) *Excluding the connector part |
Corresponding core
| PALMiCE4 CM (Cortex-M dedicated version) |
PALMiCE4 ARM (Arm 32bit version) |
PALMiCE4 ARM64 (Arm64bit version) |
|---|---|---|
| --- | Cortex-A5 / A7 / A8 / A9 / A15 | Cortex-A53 / A57 / A72 |
| --- | Cortex-R4 (F) / R5 (F) / R7 | --- |
| Cortex-M0 / M0 + / M3 / M4 (F) / M7 / M33 |
Cortex-M0 / M0 + / M3 / M4 (F) / M7 / M33 |
--- |
| --- | ARM7 / ARM9 / ARM11 | --- |
| * Multi-core debug of 32-bit processor in the device is supported. |
Related Documents
Document
| Document Title | |
|---|---|
|
Technical Information on ARM-related JTAG / SWD / SWV / ETM Target Interfaces |
|
*1:Only available for Cortex series.
*2:Some CPUs are not supported. Please contact our sales department for details.
*3:When using USB2.0, an AC adapter (5V 2A) is required.